


San Antonio’s Office Market Fundamentals Strengthen in Q4 2025
EXECUTIVE SUMMARY
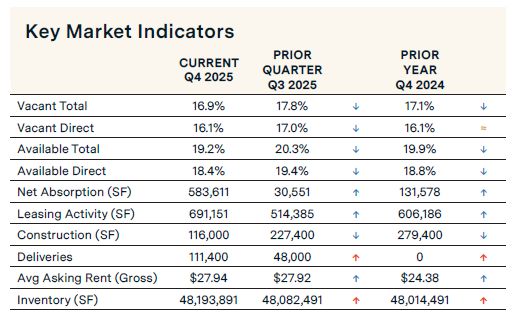
San Antonio’s office market saw a marked improvement in Q4 2025 with increased absorption, elevated leasing activity, and lower vacancy. Positive net absorption shot up sharply over the quarter, recording 583,611 sq. ft. Leasing activity increased 34.4% and the vacancy rate fell 90 basis points. The construction pipeline shrank 49% to 116,000 sq. ft. under construction. In contrast, deliveries sharply increased 132%, adding 111,400 sq. ft. to inventory. On the rental front, San Antonio’s average full-service asking rent increased to $27.94 per sq. ft., up 0.1% quarterly and 14.6% annually.
SUPPLY & DEMAND
KEY MARKET INDICATORS
MARKET OVERVIEW
San Antonio Economic Update
According to the U.S. Bureau of Labor Statistics, the San Antonio unemployment rate increased from 4.1% in August 2025 to 4.2% in September 2025. The unemployment rate in Texas jumped from 4.1% to 4.4% over the same period. San Antonio added 24,200 jobs between September 2024 and September 2025, a 1.8% change. Sectors with the largest annual gains included Education and Health Services at 6.2%, the Trade, Transportation, and Utilities sector at 2.5%, and the Total Private sector at 2.2%. The sector with the highest job losses over the year was the Information sector at -3.5%.
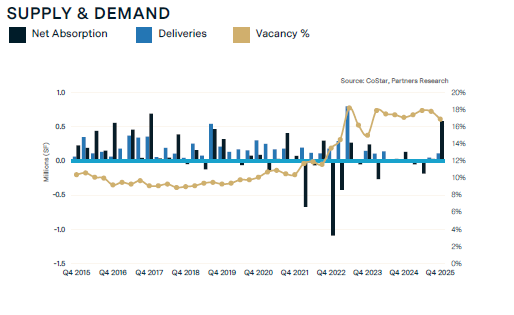
Net Absorption Sharply Increases Over the Quarter
Net absorption—move-ins minus move-outs—remained positive, recording 583,611 sq. ft. for the quarter. This was a sharp increase from the 30,551 sq. ft. of positive net absorption posted in the previous quarter. Class A properties recorded 186,906 sq. ft. of positive net absorption, while Class B properties posted 396,705 sq. ft. The Northwest Class B submarket recorded the largest amount of positive net absorption, 335,583 sq. ft., while the Northeast Class A submarket posted the highest amount of negative absorption, recording -33,816 sq. ft. The most significant move-in during Q4 2025 was Alamo Community College District’s acquisition and occupancy of the 198,119 sq. ft. 10000 Rogers Run office building in the Northwest submarket.
Deliveries Increase, Construction Pipeline Shrinks
Deliveries for the quarter increased 132% to 111,400 sq. ft., while the construction pipeline shrank 49% with 116,000 sq. ft. of new construction currently underway. The new inventory is located in the Northwest and South submarkets, while the properties under construction are in the Northwest submarket.
Leasing Activity Up Quarterly and Annually
Leasing activity came in at 691,151 sq. ft. in Q4 2025, up 34.4% from the previous quarter and up 14% from Q4 2024. One notable lease in Q4 2025 was Oracle’s 30,000 sq. ft. sublease at 19100 Ridgewood Parkway.
Vacancy Rate Decreased 90 Basis Points
The overall vacancy rate in San Antonio’s office market decreased 90 basis points to 16.9% in Q4 2025, primarily due to positive absorption and increased leasing activity. Also, vacant sublease space is minimal at 483,900 sq. ft. or 1.0% of total inventory. The CBD Class B space has the highest vacancy rate at 33%, while the South Class B submarket has the lowest at 5.7%.
Investment Sales Trends
CoStar Capital Market Analytics reports a cumulative 12-month sales volume of $71.2 million for Q4 2025. Over the past year, 43 office properties were sold, with an average price of $322 per square foot and a 7.5% average capitalization rate. Notable sales transactions in the fourth quarter include Kidman Enterprises LLC’s sale-leaseback from Humana Health Plan of Texas Inc. of a 2-building office portfolio totaling 381,400 sq. ft. located at 8119-8123 Datapoint. Also, Texas Riogrande Legal Aid Inc acquired the 21,025 sq. ft. Console office building, located at 9501 Console Dr. in the Northwest submarket, from Fisher, Herbst & Kemble, P.C. for an undisclosed amount.
Rental Rates Reach a Historic High
San Antonio’s full-service average rent stands at $27.94 per sq. ft., which is up 14.6% over the past year. Asking rents for Class A and Class B space are $29.75 per sq. ft. and $25.77 per sq. ft., respectively. Despite limited demand over the past few quarters, Class A rates increased by about 8.0% over the past year, while Class B rates rose by 16.4%.
For More Information, Contact:
Steve Triolet
SVP of Research and Market Forecasting
tel 214 223 4008
[email protected]