


Austin’s Industrial Market’s Vacancy Increases and Rents Decline in Q4 2025
EXECUTIVE SUMMARY
Q4 In Review
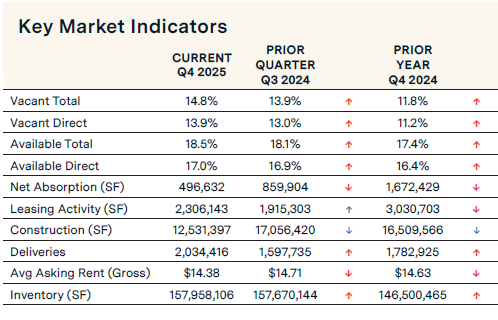
Austin’s industrial market vacancy rate increased, driven by lower absorption and higher deliveries in Q4 2025. The market recorded 496,632 sq. ft. of positive net absorption during the quarter, a 42.2% drop from the prior quarter. Warehouse/distribution properties bolstered absorption, while manufacturing recorded negative absorption. Leasing activity increased 20.4% quarter-over-quarter but decreased annually by 23.9%. The vacancy rate rose 90 basis points to 14.8% from 13.9% in the previous quarter. Available sublease space also increased, rising 40 basis points over the quarter to 18.5%.
Construction activity considerably decreased, with 12.5 million square feet underway, down 26.5% from the prior quarter. Average asking rental rates fell quarter over quarter, from $14.71 per square foot to $14.38 per square foot. Submarkets like Northwest and Central commanded the highest rates.
Austin Economic Update
Austin’s unemployment rate was 3.7% in August, up from 3.5% in May, but below the state and national rates of 4.1% and 4.3%, respectively. In August, the local labor force increased at an annualized rate of 0.7%. Austin employment increased at an annualized rate of 2.2% in August, surpassing the 1.9% growth rate in July. In the six months ending in August, employment grew 1.4%, faster than Texas and the U.S., which rose 1.2% and 0.6%, respectively.
The most significant gains from December to August were in government (3,900 jobs) and education and health services (3,200 jobs). Sectors that declined include construction and mining (-3,000 jobs) and professional and business services (-1,300 jobs).
Average hourly earnings rose to $36.41, reflecting a year-over-year increase of 5.1%. At the same time, apartment rents in Austin fell 4.1%.
MARKET OVERVIEW
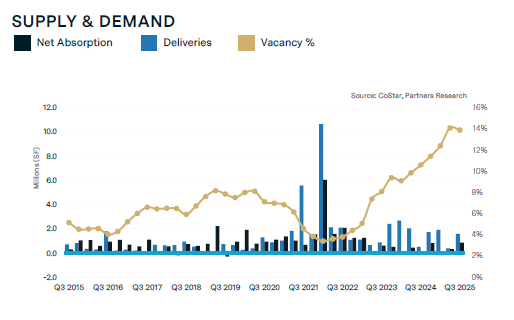
Net Absorption Down in Q4 2025
Net absorption—move-ins minus move-outs—decreased 42.2% quarterly and 70.3% annually to 496,632 sq. ft., pushing the year-end total to 3.6 million sq. ft. Warehouse/distribution properties recorded 624,493 sq. ft. of positive net absorption, driven by demand in submarkets like the Northeast, recording 552,991 sq. ft., and Georgetown, recording 502,863 sq. ft. ft. Flex space contributed the least amount of 34,538 sq. ft. and manufacturing recorded negative net absorption of -162,399 sq. ft. Notable declines were in the North (-340,298 sq. ft.) and Hays County (-167,949 sq. ft.) submarkets. Some of the tenants that moved during Q4 include Hanwha Advanced Materials America, LLC, which took 200,000 sq. ft. at 3546 N Interstate 35, and Stone Alliance Group, which took 105,000 sq. ft. at Northgate 35 Commerce Center.
Construction Pipeline Down and Deliveries Up
The construction pipeline decreased while deliveries increased over the quarter. The construction pipeline fell to 12.5 million sq. ft., down 26.5% from 17.1 million sq. ft. in the previous quarter and decreased 24.1% from 16.5 million sq. ft. a year ago. Significant construction remains concentrated in Round Rock/Hutto/Taylor (4.0 million sq. ft.) and Southeast (2.4 million sq. ft.) submarkets. Deliveries increased 27.3% quarterly to 2.0 million sq. ft. in Q4 2025 from 1.6 million sq. ft. in Q3 2025 and by 14.1% annually.
Leasing Activity Up Quarterly
Quarterly leasing velocity—new leases and renewals—rose 20.4% over the quarter to 2.3 million sq. ft. Flex leasing totaled 180,367 sq. ft., manufacturing 42,299 sq. ft., and warehouse/distribution 2.1 million sq. ft., reflecting a slowdown in flex and manufacturing. Warehouse/distribution properties saw an increase in leasing activity over the quarter. Notable leases that were signed in Q4 2025 include Compal USA Technology Inc.’s lease of 366,000 sq. ft. in TaylorPort Rail Park, Compal USA Technology Inc.’s lease of 213,000 sq. ft. at Georgetown Logistics Park, and Firefly Aerospace Inc.’s 45,000 sq. ft. lease at New Hope Distribution Center.
Vacancy Rate Increases 90 Basis Points
The overall vacancy rate rose to 14.8% in Q42025, up from 13.9% in Q3 2025, and was up annually by 25.4%, still below the historic high of 15.3% recorded in Q3 2003. The direct vacancy rate increased 90 basis points to 13.9%, while the total availability rate rose by 40 basis points to 18.5%. Georgetown posted the highest vacancy rate at 27.8%, while Bastrop County remained tight at 4%. Looking ahead, if the construction pipeline continues to rise, increasing future deliveries, Austin’s industrial market will experience higher vacancy rates in the near term.
Investment Sales Trends
CoStar Capital Market Analytics reports a cumulative 12-month sales volume of $216 million for Q4 2025. Over the past year, 130 industrial and flex properties were sold, with an average price of $170 per square foot and a 7.2% average capitalization rate. Notable sale transactions in the fourth quarter include Altura’s purchase of an 80,365 sq. ft. building in ATX 130 Distribution Park from Jackson-Shaw Company for a reported $15.3 million or $190 per square foot. Also, Reich Brothers acquired a 265,000 sq. ft. manufacturing building located at 1611 Clovis Barker Rd. from Signify for an undisclosed amount.
Rental Rates Down
Austin’s average asking rent (NNN) dropped to $14.38 per sq. ft., down 2.2% from $14.71 in Q3 2025 and down from $14.63 in Q4 2024. Flex space averaged $19.39 per sq. ft., Manufacturing $12.16 per sq. ft., and Warehouse/Distribution $12.65 per sq. ft. Submarket leaders included Central at $20.77 per sq. ft., and South at $19.02 per sq. ft. Bastrop County and Caldwell County trailed at $8.34 and $11.50 per sq. ft.
For More Information, Contact:
Steve Triolet
SVP of Research and Market Forecasting
tel 214 223 4008
[email protected]