


Houston Industrial Market Remains Healthy with Record High Rental Rates and Strong Absorption
EXECUTIVE SUMMARY
Houston’s industrial market remained healthy with increased absorption and historically high rental rates. However, vacancy experienced a slight uptick, and quarterly leasing activity slowed somewhat, but was up annually. The construction pipeline expanded both quarter-over-quarter and year-over-year. Deliveries decreased slightly over the quarter but were up sharply from a year ago. The average asking rental rate increased from the previous quarter and from a year ago, reaching a new record high. Houston’s Investment market continues to strengthen, with lower interest rates and declining cap rates.
SUPPLY & DEMAND
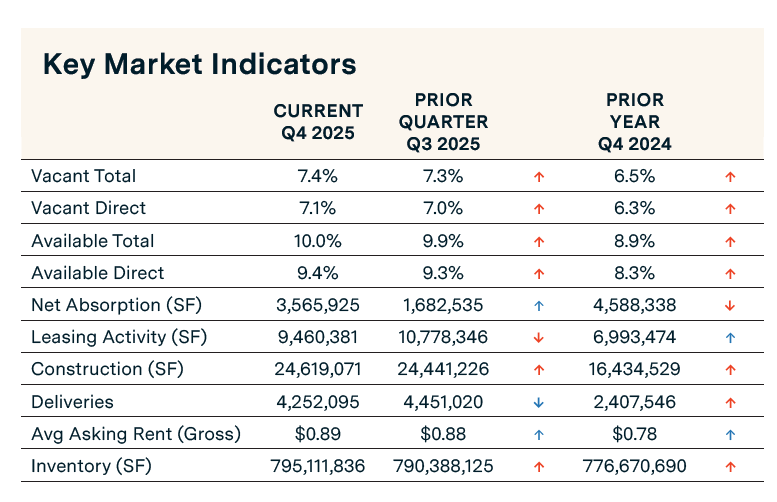
KEY MARKET INDICATORS
MARKET OVERVIEW
HOUSTON ECONOMIC UPDATE
Houston’s unemployment rate increased from 4.5% in July to 4.8% in September, and increased from 4.4% one year ago. Houston’s labor market recorded employment growth of 0.9% year-over-year (ending September 2025), adding 30.700 jobs, a decrease compared to the annual 66,700 jobs gained in September a year ago.
Job growth was uneven across sectors. Education and Health Services employment was a standout, growing at an annualized rate of 3.3% from September 2024 to September 2025 (15,100 jobs). Additional sectors showing resilience include Mining and Logging, which expanded at a 2.9% annualized rate (2,300 jobs), and the Leisure and Hospitality sector, which increased at a 2.5% annualized rate (9,000 jobs). Sectors that experienced job losses include Information, down 2.7% (700 jobs); Professional and Business Services, down 2.4% (13,700 jobs); and Manufacturing, down 0.8% (1,900 jobs).
LEASING ACTIVITY DOWN QUARTERLY, UP ANNUALLY
Quarterly leasing velocity—comprising new leases and renewals—dropped 12.2% to 9.5 million sq. ft. in Q4 2025, from 10.8 million sq. ft. in Q3 2025. Warehouse/distribution properties led the way with 8.8 million sq. ft. leased, while manufacturing activity decreased 44% to 322,500 sq. ft., and Flex decreased 49% to 382,300 sq. ft. Notable leases signed during the third quarter include Modular Power Solutions’ lease for 436,000 sq. ft. at the Maverick Distribution Center, W-Industries’ lease for 242,000 sq. ft at 11500 Antoine, and JUDA Solutions’ 103,000 sq. ft. lease in Kirkwood Industrial Park.
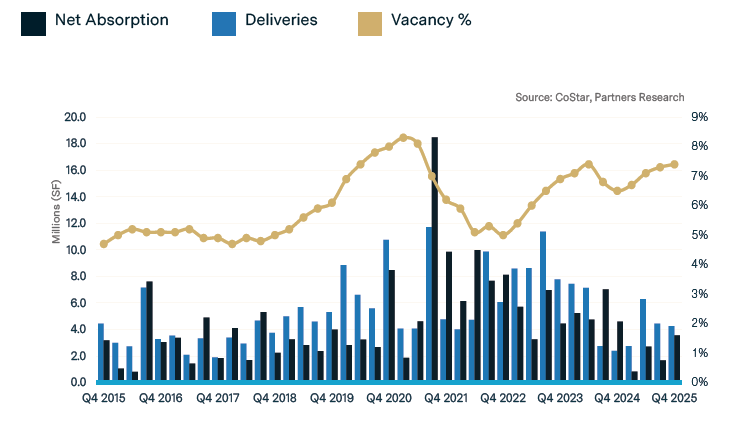
POSITIVE NET ABSORPTION ROSE OVER THE QUARTER, THOUGH STILL DOWN ANNUALLY
Net absorption reached 3.6 million sq. ft. in Q4 2025, up 112% from 1.7 million sq. ft. in Q3 2025, extending Houston’s 16-year streak of positive absorption. Warehouse/distribution space contributed to all of the positive absorption, recording 4.0 million sq. ft. in Q4 2025. Manufacturing and flex space posted negative absorption of -404,940 sq. ft. and -61,780 sq. ft., respectively. Key submarkets driving gains were Southwest (1.7 million sq. ft.) and Northwest (980,779 sq. ft.). Notable tenant moves during Q4 2025 include Pepsi moving into 1.0 million sq. ft. at I-10 West Trade Center, Inventec occupying 540,000 sq. ft. at Park 1099, and ProEnergy moving into 458,000 sq. ft. at NW Reservoir District, Building G.
VACANCY RATE INCHES UP TO 7.4%
The overall vacancy rate rose to 7.4% in Q4 2025, up 10 basis points from 7.3% in Q3 2025 and increased 90 basis points from 6.5% in Q4 2024. Flex space vacancy held the highest vacancy rate at 10.9%, while manufacturing stayed tight at 2.3%. The warehouse/distribution vacancy rate decreased to 7.9%. Total availability increased 10 basis points to 10.0%.
CONSTRUCTION PIPELINE FLAT, DELIVERIES DOWN 4.5%
The construction pipeline remained relatively flat, increasing to 24.6 million sq. ft., a 0.7% increase from 24.4 million sq. ft. in Q3 2025. Deliveries decreased by 4.5% to 4.3 million sq. ft. in Q4 2025 from 4.5 million in the previous quarter. Year-over-year deliveries increased 76.6% from 2.4 million sq. ft. in Q4 2024. The lack of entitled properties in the greater Houston MSA continues to constrain supply growth, maintaining market equilibrium despite rising demand.
AVERAGE ASKING RENTS INCH UP TO A RECORD $0.89 PER SQ. FT.
The average monthly rental rate (NNN) reached $0.89 per sq. ft., up 2.1% from $0.88 in Q3 2025 and up 13.8% from $0.78 in Q4 2024. Flex space has the highest asking rate of $0.99 per sq. ft., followed surprisingly by manufacturing at $0.91 per sq. ft, and warehouse/distribution space has an average lease rate of $0.86 per sq. ft. The Southwest submarket posted the highest rental rate at $1.05 per sq. ft., followed by the Northwest submarket at $0.93 per sq. ft.
INVESTMENT SALES TRENDS
In the fourth quarter of 2025, 318 Industrial and Flex properties totaling 15.2 million sq. ft. sold for a total sales volume of $188 million. The average price per square foot was $130, with a 10.0% average capitalization rate. Notable sales transactions in Q4 2025 include Prologis, Inc.’s sale of a two-property, 9-building portfolio, which consists of the Park Beltway at Antoine (7 buildings, 384,730 sq. ft.) and Fairbanks Eight (2 buildings, 180-,152 sq. ft). MDH Partners purchased the portfolio for an undisclosed amount. NorthPoint Development acquired Empire West, a 750,775 sq. ft., five-property portfolio, from Stream Realty Partners, LP for an undisclosed price.
For More Information, Contact:
Steve Triolet
SVP of Research and Market Forecasting
tel 214 223 4008
[email protected]