


Demand for Class A Properties Remains Healthy and Rental Rates Rise
EXECUTIVE SUMMARY
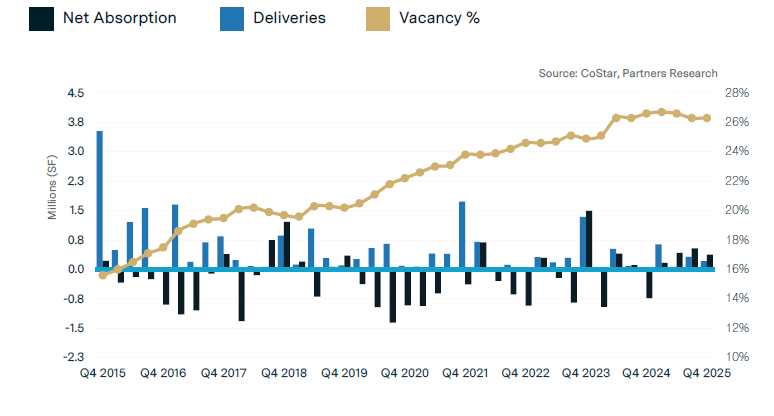
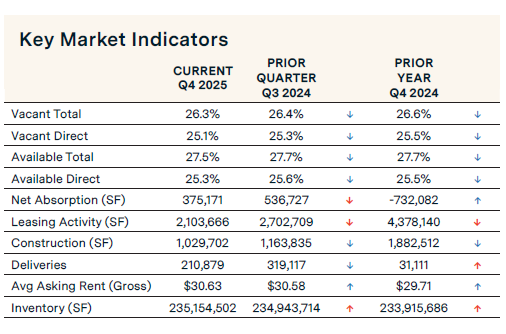
Houston’s office market in Q4 2025 remained healthy with increased rental rates and lower vacancy despite a drop in absorption and leasing activity. Net absorption decreased to 375,171 sq. ft. from 536,727 sq. ft. recorded in the previous quarter. Vacancy rates edged down to 26.3%, reflecting a 10-basis-point decrease from Q3 2025. Leasing activity declined 22.2% to 2.1 million sq. ft. Twelve submarkets posted positive absorption, with Class A properties accounting for the majority. Construction deliveries decreased 33.9%, adding 210,879 sq. ft. to office inventory. The construction pipeline dropped 11.5% to 1.0 million sq. ft. Rental rates increased quarterly by 0.2% to $30.63 per sq. ft. Class A property rental rates rose slightly to $35.81 per sq. ft., and the overall Class B average rental rate is $23.22 per sq. ft.
SUPPLY & DEMAND
KEY MARKET INDICATORS
MARKET OVERVIEW
HOUSTON ECONOMIC UPDATE
Houston’s unemployment rate increased from 4.5% in July to 4.8% in September, and increased from 4.4% one year ago. Houston’s labor market recorded employment growth of 0.9% year-over-year (ending September 2025), adding 30.700 jobs, a decrease compared to the annual 66,700 jobs gained in September a year ago.
Job growth was uneven across sectors. Education and Health Services employment was a standout, growing at an annualized rate of 3.3% year-over-year (15,100 jobs) from September 2024 to September 2025. Additional sectors showing resilience include Mining and Logging, which expanded at a 2.9% annualized rate (2,300 jobs), and the Leisure and Hospitality sector, which increased at a 2.5% annualized rate (9,000 jobs). Sectors that experienced job losses include Information, down 2.7% (700 jobs); Professional and Business Services, down 2.4% (13,700 jobs); and Manufacturing, down 0.8% (1,900 jobs).
NET ABSORPTION REMIANED POSITIVE IN Q4 2025
In Q4 2025, the Houston office market recorded 375,171 sq. ft. of positive net absorption, down from 536,727 sq. ft. in Q3 2025. Class A properties contributed 353,408 sq. ft., while Class B properties recorded 21,763 sq. ft., representing a significant shift in favor of Class A properties. At the submarket level, 12 submarkets posted total positive absorption in Q4 2025, with the CBD (473,744 sq. ft.) and Galleria/West Loop (277,038 sq. ft.) recording the highest levels. The Katy Freeway submarket (-542,550 sq. ft.) recorded the highest negative absorption, driven by the ConocoPhillips space at 990 Town & Country Blvd., which was officially released to the market after the recent sale of the building. Some of the tenants that contributed to the positive absorption recorded in Q4 2025 include NRG Energy, Inc., which moved into 255,000 sq. ft. at 1301 McKinney St., relocating from 498,000 sq. ft. at 910 Louisiana. Westlake Corporation moved into 126,000 sq. ft. in 5444 Westheimer.
LEASING VELOCITY DECREASES 22.2%
Quarterly leasing velocity—comprised of new leases and renewals—decreased to 2.1 million sq. ft. from 2.7 million sq. ft. in Q3 2025. Notable leases in Q4 2025 include Caturus (formerly Kimmeridge Energy), which signed a 90,700 sq. ft. lease at 990 Town & Country Blvd., the former ConocoPhillips building; Fervo Energy, which signed a 53,700 sq. ft. lease at 911 Main St, and Corient, a national wealth management firm, signed a 39,900 sq. ft. lease at Autry Park, which is currently under construction.
VACANCY RATE INCHES DOWN
The overall vacancy rate in Houston’s office market decreased to 26.3% in Q4 2025, down 10 basis points from 26.4% in Q3 2025. Class A properties reported a vacancy rate of 27.3%, while Class B properties reported a vacancy rate of 25.1%. Submarkets, including Greenspoint/North Belt and FM 1960/Hwy 249, had the highest vacancy rates at 49.1% and 37.8%, respectively. In contrast, Pearland/South, Northeast, and Woodlands/Conroe had the lowest rates at 8.9%, 10.2%, and 14.8%, respectively.
QUARTERLY DELIVERIES UP AND CONSTRUCTION DOWN
New office deliveries in Q4 2025 totaled 210,879 sq. ft., down from 319,117 sq. ft. in Q3 2025, with submarket contributions from Southwest (67,475 sq. ft.), Northeast (53,925 sq. ft.), Kingwood/Humble (32,625 sq. ft.), Sugar Land/E Ft Bend (32,000 sq. ft.), and Katy/Grand Pkwy W (24,854 sq. ft.). The construction pipeline fell 11.5% over the quarter to 1.0 million sq. ft., an annual decline of 45.3%.
INVESTMENT SALES TRENDS
According to CoStar, 126 Class A and B office properties totaling 21.8 million sq. ft. were sold in 2025. Total sales volume was $528 million, with an average price per square foot of $93 and an average cap rate of 8.1%. Some of the more recent sales in Q4 2025 included Brookfield Properties’ sale of the 1.3 million-square-foot, Class A, 1600 Smith to the Houston Police Officers Pension System for an undisclosed price. Also, Spear Street Capital sold the 604,000-square-foot, Class A, 5 Houston Center to Tourmaline Capital Partners for an undisclosed price. The property is 96.5% leased.
ASKING RATES MARGINALLY INCREASE
Average asking rental rates increased 0.2% quarterly and 3.1% annually to $30.63 per sq. ft. in Q4 2025. Class A properties averaged $35.81 per sq. ft., while Class B properties averaged $23.22 per sq. ft. Premium submarkets such as CBD ($37.98 per sq. ft.), The Woodlands/Conroe ($37.70), and Katy Freeway ($37.02 per sq. ft.) continued to command higher rents. The submarkets with the lowest average asking rental rates are Greenspoint/North Belt ($17.45 per sq. ft.), FM 1960 ($21.90 per sq. ft.), and Southwest ($22.30 per sq. ft.).
For More Information, Contact:
Steve Triolet
SVP of Research and Market Forecasting
tel 214 223 4008
[email protected]